文章目录
- 0. 引言
- 1. 功能
- 2.使用步骤
- 3. 程序架构
- 流程图
- 结构图
- 4. 数据解析模块
- 5. 图表绘制模块
- 6. 主程序入口
- 7. 总结
- 8. 附录完整代码
0. 引言
在性能调优和系统监控中,top 命令是一种重要工具,提供了实时的系统状态信息,如 CPU 使用率、内存使用情况和进程状态。然而,仅凭命令行输出可能无法满足复杂的分析需求。
本文将介绍如何解析 top 命令的输出,并利用 Python 生成动态图表,以更直观地展示系统性能数据。
1. 功能
-
解析
top输出:- 解析
top -1 -H -b -n 1800 -d 1获取的进程信息,文本数据通过pandas库处理,并使用matplotlib生成动态图表。 - 提取每个进程的 PID、用户、CPU 使用率、内存使用率、运行时间和命令信息。
- 解析
-
生成动态图表:
- 绘制系统总体内存使用情况的动态曲线(总内存、空闲内存、使用内存、缓存/缓冲区内存)。
- 绘制指定进程或线程的 CPU 和内存使用情况的动态曲线。
2.使用步骤
- dump top文本信息
-
需要系统统计的设备中,使用如下命令获取top信息
top -1 -H -b -n 1800 -d 1 > topdump.txt。
参数-n 1800指定了top命令执行的次数,即执行1800次。而参数-d 1则指定了每次执行之间的时间间隔为1秒,意味着top命令每隔1秒就会输出一次进程信息。 -
注意:dump top信息时,请避免做其他操作以降低干扰。
-
-
使用以下命令解析
top输出文件并生成动态图表:python top_parser.py --file topdump.txt --process <process_name> --show_threads --save_fig- 参数说明:
--file:指定top输出文件的路径。--process:指定要绘制的进程名称。--show_threads:可选参数,显示进程内所有线程的详细信息。--save_fig:可选参数,保存生成的图表为 PNG 图像文件。
- 参数说明:
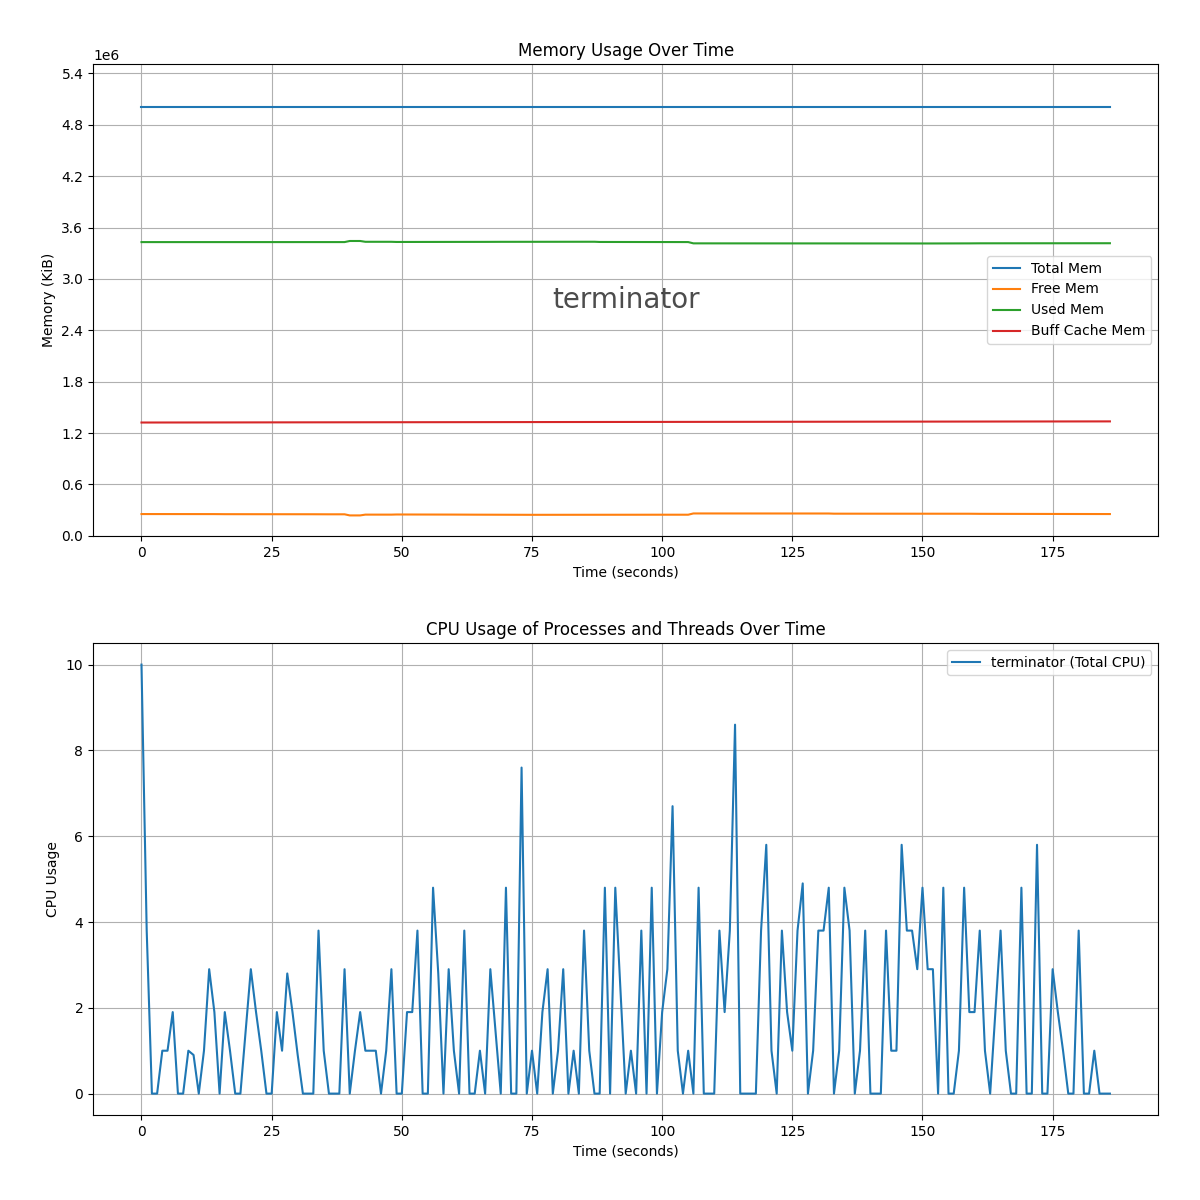
- 如下图是使用
python topparser.py --file topdump.txt --process terminator --save_fig生成的:
3. 程序架构
本程序主要分为以下几个模块:
-
数据解析模块:负责解析
top命令的输出文本,并将提取的数据存储到pandas的数据帧中。 -
图表绘制模块:基于解析得到的数据帧,使用
matplotlib生成动态图表。 -
主程序入口:处理命令行参数,调用数据解析模块和图表绘制模块完成数据处理和图表生成的流程。
流程图
流程图将展示数据解析模块、图表绘制模块和主程序入口之间的交互过程。以下是流程图的示意:
结构图
结构图将展示程序的整体架构,包括数据解析模块、图表绘制模块和主程序入口的功能组成及其关系。以下是结构图的示意:
4. 数据解析模块
数据解析模块的主要任务是读取 top 命令的输出文件,识别其格式并提取出需要的性能指标和进程信息。以下是核心代码片段的部分实现:
# 数据解析模块核心代码示例
import pandas as pd
import re

def parse_top_output(file_path):
    columns = ['timestamp', 'total_mem', 'free_mem', 'used_mem', 'buff_cache_mem', 'pid', 'user', 'cpu', 'mem', 'time', 'command']
    data = {col: [] for col in columns}

    with open(file_path, 'r') as file:
        lines = file.readlines()

    timestamp = None
    format_type = None
    for line in lines:
        if line.startswith('top -'):
            timestamp = re.search(r'top - (\d+:\d+:\d+)', line).group(1)
        elif 'KiB Mem :' in line or 'GiB Mem :' in line:
            format_type = 'format1' if 'KiB Mem :' in line else 'format2'
            mem_info = re.findall(r'[\d\.]+', line)
            if format_type == 'format1':
                data['total_mem'].append(int(mem_info[0]))
                data['free_mem'].append(int(mem_info[1]))
                data['used_mem'].append(int(mem_info[2]))
                data['buff_cache_mem'].append(int(mem_info[3]))
            else:
                total_mem_gb = float(mem_info[0])
                data['total_mem'].append(total_mem_gb * 1024 * 1024)
                data['free_mem'].append(None)
                data['used_mem'].append(None)
                data['buff_cache_mem'].append(None)
            data['timestamp'].append(timestamp)
            data['pid'].append(None)
            data['user'].append(None)
            data['cpu'].append(None)
            data['mem'].append(None)
            data['time'].append(None)
            data['command'].append(None)
        elif re.match(r'\s*\d+', line) or re.match(r'\s*\d+\s+\w+', line):
            if format_type == 'format1':
                proc_info = re.split(r'\s+', line.strip(), maxsplit=11)
                data['pid'].append(int(proc_info[0]))
                data['user'].append(proc_info[1])
                data['cpu'].append(float(proc_info[8]))
                data['mem'].append(float(proc_info[9]))
                data['time'].append(proc_info[10])
                data['command'].append(proc_info[11] if len(proc_info) > 11 else "")
            elif format_type == 'format2':
                proc_info = re.split(r'\s+', line.strip(), maxsplit=10)
                data['pid'].append(int(proc_info[0]))
                data['user'].append(proc_info[1])
                try:
                    cpu_value = float(proc_info[5].strip('%')) if '%' in proc_info[5] else float(proc_info[5])
                    mem_value = float(proc_info[6].strip('%')) if '%' in proc_info[6] else float(proc_info[6])
                except ValueError:
                    cpu_value = 0.0
                    mem_value = 0.0
                data['cpu'].append(cpu_value)
                data['mem'].append(mem_value)
                data['time'].append(proc_info[7])
                data['command'].append(proc_info[9] if len(proc_info) > 9 else "")
            data['timestamp'].append(timestamp)
            data['total_mem'].append(None)
            data['free_mem'].append(None)
            data['used_mem'].append(None)
            data['buff_cache_mem'].append(None)
        else:
            data['timestamp'].append(timestamp)
            for key in data:
                if key not in ['timestamp']:
                    data[key].append(None)

    df = pd.DataFrame(data)
    df['timestamp'] = pd.to_datetime(df['timestamp'], format='%H:%M:%S')
    df['relative_time'] = (df['timestamp'] - df['timestamp'].min()).dt.total_seconds()
    return df
5. 图表绘制模块
图表绘制模块利用 matplotlib 库生成动态图表,以下是绘制内存使用动态曲线和进程线程动态曲线的核心代码片段:
# 图表绘制模块核心代码示例
import matplotlib.pyplot as plt
from matplotlib.ticker import MaxNLocator, AutoLocator

def plot_memory_usage(ax, df, process_name=None):
    if 'relative_time' not in df.columns:
        print("relative_time column is missing in the dataframe")
        return

    memory_cols = ['total_mem', 'free_mem', 'used_mem', 'buff_cache_mem']
    df_memory = df.dropna(subset=memory_cols).drop_duplicates(subset=['relative_time'])

    max_memory = df_memory[memory_cols].max().max()  # 获取内存使用的最大值

    for col in memory_cols:
        ax.plot(df_memory['relative_time'], df_memory[col], label=col.replace('_', ' ').title())

    ax.set_xlabel('Time (seconds)')
    ax.set_ylabel('Memory (KiB)')
    ax.set_ylim(0, max_memory * 1.1 if max_memory > 0 else 1)
    ax.set_title('Memory Usage Over Time')
    if process_name:
        ax.text(0.5, 0.5, process_name, transform=ax.transAxes, fontsize=20, ha='center', va='center', alpha=0.7, color='black')
    ax.legend()
    ax.grid(True)
    ax.xaxis.set_major_locator(AutoLocator())
    ax.yaxis.set_major_locator(MaxNLocator(integer=True))

    return ax

def plot_process_threads(ax, df, processes, show_threads, metric='cpu'):
    for process in processes:
        df_process = df[df['command'].str.contains(process, na=False)]
        if show_threads:
            unique_pids = df_process['pid'].unique()
            for pid in unique_pids:
                df_pid = df_process[df_process['pid'] == pid]
                ax.plot(df_pid['relative_time'], df_pid[metric], label=f'{process} {metric.upper()} (PID {pid})')
        else:
            df_process_grouped = df_process.groupby('relative_time').agg({metric: 'sum'}).reset_index()
            ax.plot(df_process_grouped['relative_time'], df_process_grouped[metric], label=f'{process} (Total {metric.upper()})')
    ax.set_xlabel('

Time (seconds)')
    ax.set_ylabel(f'{metric.upper()} Usage')
    ax.set_title(f'{metric.upper()} Usage of Processes and Threads Over Time')
    ax.legend()
    ax.grid(True)
    ax.xaxis.set_major_locator(AutoLocator())
    ax.yaxis.set_major_locator(MaxNLocator(integer=True))

    return ax
6. 主程序入口
主程序入口负责处理命令行参数,并调用数据解析和图表绘制模块完成数据处理和图表生成的流程。以下是主程序入口的核心代码片段:
# 主程序入口核心代码示例
import argparse

def main(file_path, processes, show_threads, save_fig=False):
    df = parse_top_output(file_path)
    plot_all(df, processes, show_threads, save_fig)

if __name__ == "__main__":
    parser = argparse.ArgumentParser(description='Parse and plot top command output.')
    parser.add_argument('--file', type=str, required=True, help='Path to the top output file')
    parser.add_argument('--process', type=str, nargs='+', required=True, help='List of processes to plot')
    parser.add_argument('--show_threads', action='store_true', help='Show CPU and memory for all threads within the process')
    parser.add_argument('--save_fig', action='store_true', help='Save the generated plots as PNG images')

    args = parser.parse_args()
    main(args.file, args.process, args.show_threads, args.save_fig)
7. 总结
通过本文介绍的方法,可以有效解析 top 命令输出并生成动态图表,帮助用户更直观地分析系统性能数据。该方法不仅支持不同格式的 top 输出,还能够灵活配置,满足各种监控需求。
8. 附录完整代码
import pandas as pd
import matplotlib.pyplot as plt
import re
import argparse
from matplotlib.ticker import MaxNLocator, AutoLocator

# 解析top命令输出
def parse_top_output(file_path):
    columns = ['timestamp', 'total_mem', 'free_mem', 'used_mem', 'buff_cache_mem', 'pid', 'user', 'cpu', 'mem', 'time', 'command']
    data = {col: [] for col in columns}

    with open(file_path, 'r') as file:
        lines = file.readlines()

    timestamp = None
    format_type = None
    for line in lines:
        if line.startswith('top -'):
            timestamp = re.search(r'top - (\d+:\d+:\d+)', line).group(1)
        elif 'KiB Mem :' in line or 'GiB Mem :' in line:
            format_type = 'format1' if 'KiB Mem :' in line else 'format2'
            mem_info = re.findall(r'[\d\.]+', line)
            if format_type == 'format1':
                data['total_mem'].append(int(mem_info[0]))
                data['free_mem'].append(int(mem_info[1]))
                data['used_mem'].append(int(mem_info[2]))
                data['buff_cache_mem'].append(int(mem_info[3]))
            else:
                total_mem_gb = float(mem_info[0])
                data['total_mem'].append(total_mem_gb * 1024 * 1024)
                data['free_mem'].append(None)
                data['used_mem'].append(None)
                data['buff_cache_mem'].append(None)
            data['timestamp'].append(timestamp)
            data['pid'].append(None)
            data['user'].append(None)
            data['cpu'].append(None)
            data['mem'].append(None)
            data['time'].append(None)
            data['command'].append(None)
        elif re.match(r'\s*\d+', line) or re.match(r'\s*\d+\s+\w+', line):
            if format_type == 'format1':
                proc_info = re.split(r'\s+', line.strip(), maxsplit=11)
                data['pid'].append(int(proc_info[0]))
                data['user'].append(proc_info[1])
                data['cpu'].append(float(proc_info[8]))
                data['mem'].append(float(proc_info[9]))
                data['time'].append(proc_info[10])
                data['command'].append(proc_info[11] if len(proc_info) > 11 else "")
            elif format_type == 'format2':
                proc_info = re.split(r'\s+', line.strip(), maxsplit=10)
                data['pid'].append(int(proc_info[0]))
                data['user'].append(proc_info[1])
                try:
                    cpu_value = float(proc_info[5].strip('%')) if '%' in proc_info[5] else float(proc_info[5])
                    mem_value = float(proc_info[6].strip('%')) if '%' in proc_info[6] else float(proc_info[6])
                except ValueError:
                    cpu_value = 0.0
                    mem_value = 0.0
                data['cpu'].append(cpu_value)
                data['mem'].append(mem_value)
                data['time'].append(proc_info[7])
                data['command'].append(proc_info[9] if len(proc_info) > 9 else "")
            data['timestamp'].append(timestamp)
            data['total_mem'].append(None)
            data['free_mem'].append(None)
            data['used_mem'].append(None)
            data['buff_cache_mem'].append(None)
        else:
            data['timestamp'].append(timestamp)
            for key in data:
                if key not in ['timestamp']:
                    data[key].append(None)

    df = pd.DataFrame(data)
    df['timestamp'] = pd.to_datetime(df['timestamp'], format='%H:%M:%S')
    df['relative_time'] = (df['timestamp'] - df['timestamp'].min()).dt.total_seconds()
    return df

# 将时间戳转换为秒数
def convert_timestamp_to_seconds(timestamp):
    h, m, s = map(int, timestamp.split(':'))
    return h * 3600 + m * 60 + s

# 绘制内存动态曲线
def plot_memory_usage(ax, df, process_name=None):
    if 'relative_time' not in df.columns:
        print("relative_time column is missing in the dataframe")
        return

    memory_cols = ['total_mem', 'free_mem', 'used_mem', 'buff_cache_mem']
    df_memory = df.dropna(subset=memory_cols).drop_duplicates(subset=['relative_time'])

    max_memory = df_memory[memory_cols].max().max()  # 获取内存使用的最大值

    for col in memory_cols:
        ax.plot(df_memory['relative_time'], df_memory[col], label=col.replace('_', ' ').title())

    ax.set_xlabel('Time (seconds)')
    ax.set_ylabel('Memory (KiB)')
    ax.set_ylim(0, max_memory * 1.1 if max_memory > 0 else 1)
    ax.set_title('Memory Usage Over Time')
    if process_name:
        ax.text(0.5, 0.5, process_name, transform=ax.transAxes, fontsize=20, ha='center', va='center', alpha=0.7, color='black')
    ax.legend()
    ax.grid(True)
    ax.xaxis.set_major_locator(AutoLocator())
    ax.yaxis.set_major_locator(MaxNLocator(integer=True))

    return ax

# 绘制进程和线程动态曲线
def plot_process_threads(ax, df, processes, show_threads, metric='cpu'):
    for process in processes:
        df_process = df[df['command'].str.contains(process, na=False)]
        if show_threads:
            unique_pids = df_process['pid'].unique()
            for pid in unique_pids:
                df_pid = df_process[df_process['pid'] == pid]
                ax.plot(df_pid['relative_time'], df_pid[metric], label=f'{process} {metric.upper()} (PID {pid})')
        else:
            df_process_grouped = df_process.groupby('relative_time').agg({metric: 'sum'}).reset_index()
            ax.plot(df_process_grouped['relative_time'], df_process_grouped[metric], label=f'{process} (Total {metric.upper()})')
    ax.set_xlabel('Time (seconds)')
    ax.set_ylabel(f'{metric.upper()} Usage')
    ax.set_title(f'{metric.upper()} Usage of Processes and Threads Over Time')
    ax.legend()
    ax.grid(True)
    ax.xaxis.set_major_locator(AutoLocator())
    ax.yaxis.set_major_locator(MaxNLocator(integer=True))

    return ax

# 绘制图表
def plot_all(df, processes, show_threads, save_fig=False):
    for process in processes:
        fig, axes = plt.subplots(nrows=2, ncols=1, figsize=(12, 12))
        df_process = df[df['command'].str.contains(process, na=False)]
        if show_threads:
            plot_process_threads(axes[0], df_process, [process], show_threads, metric='mem')
            plot_process_threads(axes[1], df_process, [process], show_threads, metric='cpu')
        else:
            plot_memory_usage(axes[0], df, process_name=process)
            plot_process_threads(axes[1], df, [process], show_threads)

        plt.tight_layout(pad=3.0)

        if save_fig:
            fig.savefig(f'{process}_analysis.png')  # 保存图像

        plt.show()

# 主函数
def main(file_path, processes, show_threads, save_fig=False):
    df = parse_top_output(file_path)
    plot_all(df, processes, show_threads, save_fig)

# 处理命令行参数
if __name__ == "__main__":
    parser = argparse.ArgumentParser(description='Parse and plot top command output.')
    parser.add_argument('--file', type=str, required=True, help='Path to the top output file')
    parser.add_argument('--process', type=str, nargs='+', required=True, help='List of processes to plot')
    parser.add_argument('--show_threads', action='store_true', help='Show CPU and memory for all threads within the process')
    parser.add_argument('--save_fig', action='store_true', help='Save the generated plots as PNG images')

    args = parser.parse_args()
    main(args.file, args.process, args.show_threads, args.save_fig)